

|

|

|

|

|

|

|

|
| |
| * |


![]()
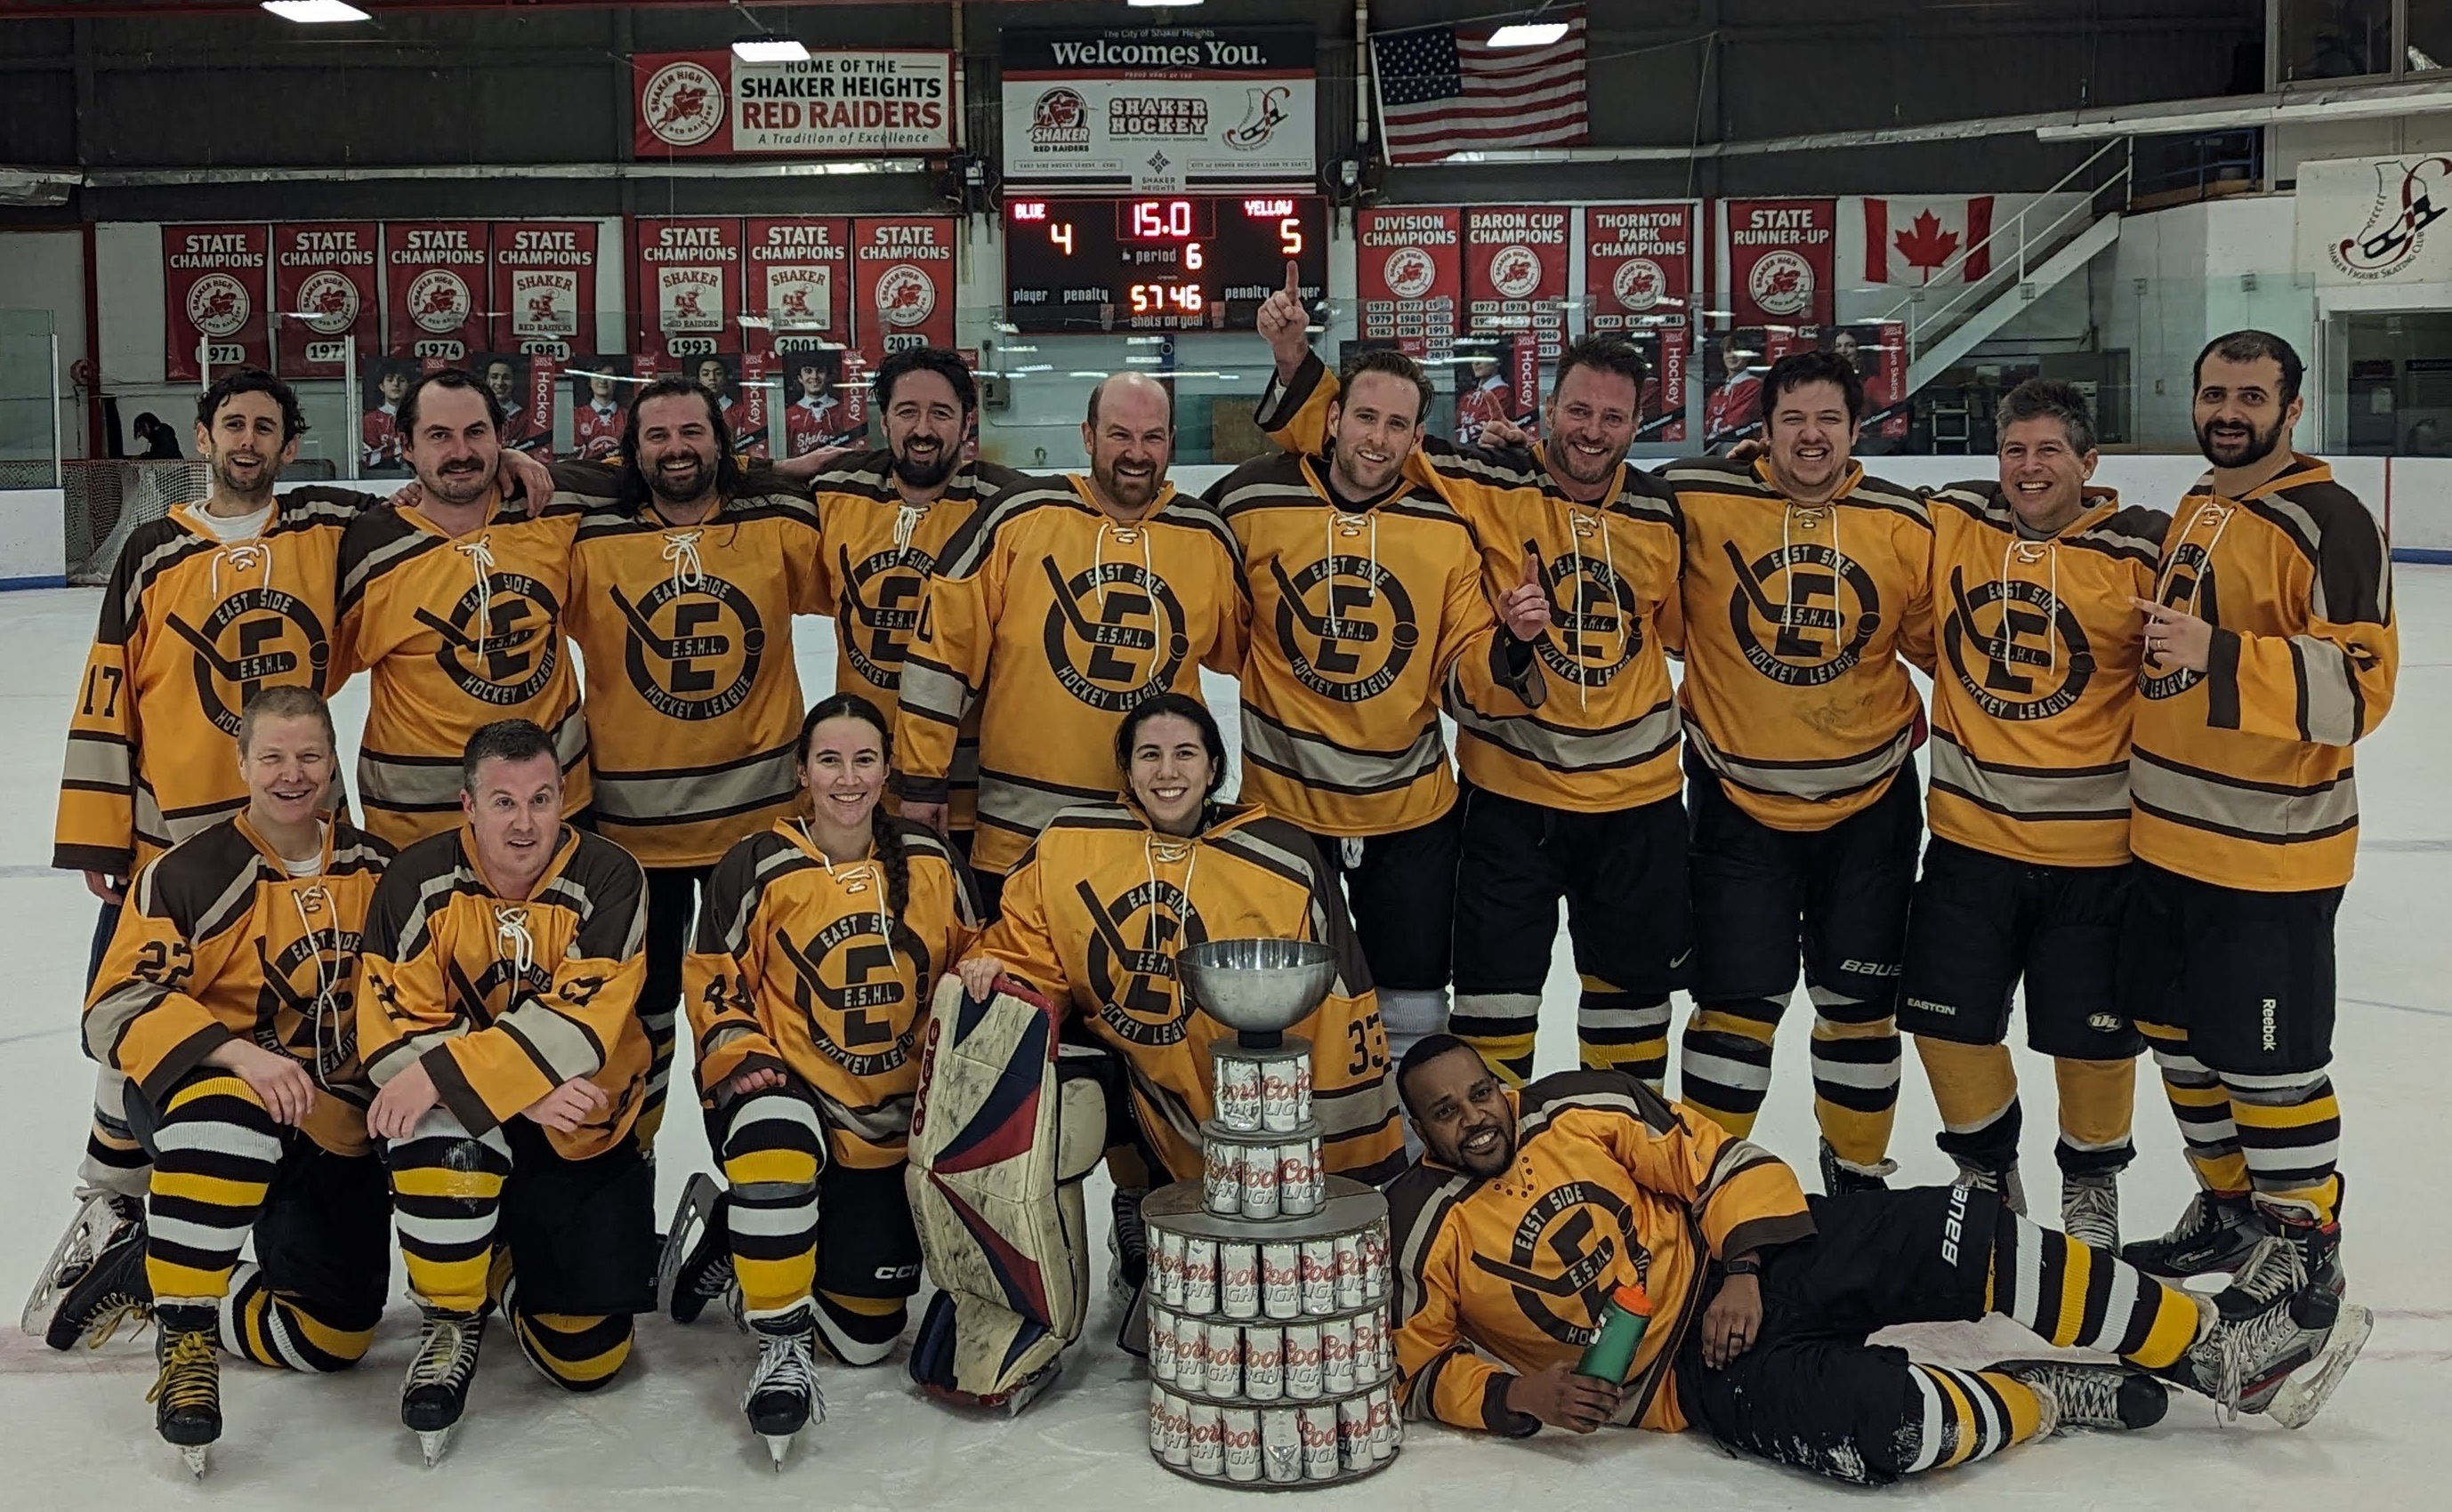
E.S.H.L. PLAYOFFS HOCKEY FALL-WINTER 2023-24 PS LEAGUE
CONGRATULATIONS TO THE YELLOW TEAM EAST SIDE HOCKEY LEAGUE FALL-WINTER 2023-24 POST SEASON CHAMPIONS!!
CONGRATULATIONS TO THE BLUE TEAM EAST SIDE HOCKEY LEAGUE FALL-WINTER 2023-24 POST SEASON RUNNERS-UP!!
2/29/24 | PRINTOUT #: 2
BLUE ( 2 - 2 - 0 )
Individual Team Statistics
| Players | GP | G | A | PTS | SOG | SPCT | PIM | G/G | A/G | P/G | S/G | PIM/G | HT | PM | GS | LS | |
|---|---|---|---|---|---|---|---|---|---|---|---|---|---|---|---|---|---|
|
1 .
|
Jeff Deacon | 4 | 5 | 2 | 7 | 24 | 0.208 | 2 | 1.25 | 0.50 | 1.75 | 6.00 | 0.50 | 0 | 0 | 4 | 4 |
|
2 .
|
Mark Wilson | 3 | 3 | 1 | 4 | 14 | 0.214 | 0 | 1.00 | 0.33 | 1.33 | 4.67 | 0.00 | 0 | 0 | 1 | 1 |
|
3 .
|
Bryce Connor | 2 | 0 | 4 | 4 | 10 | 0.000 | 0 | 0.00 | 2.00 | 2.00 | 5.00 | 0.00 | 0 | 1 | 0 | 0 |
|
4 .
|
Dan Bacon | 4 | 0 | 4 | 4 | 11 | 0.000 | 0 | 0.00 | 1.00 | 1.00 | 2.75 | 0.00 | 0 | 0 | 0 | 0 |
|
5 .
|
Rich Garcia | 4 | 2 | 2 | 4 | 23 | 0.087 | 2 | 0.50 | 0.50 | 1.00 | 5.75 | 0.50 | 0 | 0 | 1 | 1 |
|
6 .
|
Alex Frazier | 2 | 1 | 2 | 3 | 11 | 0.091 | 2 | 0.50 | 1.00 | 1.50 | 5.50 | 1.00 | 0 | 0 | 0 | 1 |
|
7 .
|
Brian Callow | 2 | 0 | 2 | 2 | 4 | 0.000 | 2 | 0.00 | 1.00 | 1.00 | 2.00 | 1.00 | 0 | 0 | 0 | 0 |
|
8 .
|
Jimmy Moore | 4 | 0 | 1 | 1 | 3 | 0.000 | 2 | 0.00 | 0.25 | 0.25 | 0.75 | 0.50 | 0 | 0 | 0 | 0 |
|
9 .
|
Karen Lingas | 4 | 0 | 1 | 1 | 7 | 0.000 | 0 | 0.00 | 0.25 | 0.25 | 1.75 | 0.00 | 0 | 0 | 0 | 0 |
|
10 .
|
Dan Burns | 3 | 1 | 0 | 1 | 9 | 0.111 | 0 | 0.33 | 0.00 | 0.33 | 3.00 | 0.00 | 0 | 0 | 0 | 1 |
|
11 .
|
Brandon Bailey | 2 | 1 | 0 | 1 | 5 | 0.200 | 2 | 0.50 | 0.00 | 0.50 | 2.50 | 1.00 | 0 | 0 | 1 | 1 |
|
12 .
|
Jacob Hoberman | 4 | 1 | 0 | 1 | 7 | 0.143 | 10 | 0.25 | 0.00 | 0.25 | 1.75 | 2.50 | 0 | 0 | 0 | 1 |
|
13 .
|
Wes Deacon G | 2 | 0 | 0 | 0 | 0 | 0.000 | 0 | 0.00 | 0.00 | 0.00 | 0.50 | 0.00 | 0 | 0 | 0 | 0 |
|
14 .
|
Regis Mullen S G | 2 | 0 | 0 | 0 | 0 | 0.000 | 0 | 0.00 | 0.00 | 0.00 | 0.50 | 0.00 | 0 | 0 | 0 | 0 |
|
15 .
|
Mark Grey | 4 | 0 | 0 | 0 | 7 | 0.000 | 2 | 0.00 | 0.00 | 0.00 | 1.75 | 0.50 | 0 | 0 | 0 | 0 |
|
16 .
|
Brian FitzGerald | 1 | 0 | 0 | 0 | 0 | 0.000 | 0 | 0.00 | 0.00 | 0.00 | 1.00 | 0.00 | 0 | 0 | 0 | 0 |
| TOTALS | 4 | 14 | 19 | 33 | 135 | 0.104 | 24 | 3.50 | 4.75 | 8.25 | 33.75 | 6.00 | 0 | 1 | - | - |
Individual Goalie Statistics
| Players | GP | W | L | T | GAA | PER | SV | SV% | SA | GA | SHO | SA1 | GA1 | SA2 | GA2 | SA3 | GA3 | |
|---|---|---|---|---|---|---|---|---|---|---|---|---|---|---|---|---|---|---|
|
1 .
|
Regis Mullen S G | 2 | 1 | 1 | 0 | 3.00 | 6 | 71 | 0.922 | 77 | 6 | 0 | 18 | 2 | 20 | 1 | 39 | 3 |
|
2 .
|
Wes Deacon G | 2 | 1 | 1 | 0 | 4.00 | 6 | 45 | 0.849 | 53 | 8 | 0 | 17 | 2 | 18 | 3 | 18 | 3 |
| TOTALS | 4 | 0 | 0 | 0 | 3.50 | 0 | 116 | 0.892 | 130 | 14 | 0 | 35 | 4 | 38 | 4 | 57 | 6 |
Team Record: 2 - 2 - 0 (0.500 )
| Game 1 2/20 6- 2 WHITE HOME |
Game 2 2/25 2- 6 YELLOW HOME |
Game 3 2/27 2- 1 YELLOW AWAY |
Game 4 2/29 4- 5 YELLOW HOME |
Goals Scored
Goals Allowed
3.50
goals/game
goals/game
3.50
goals/game
goals/game
Differential
+0.00
goals/game
goals/game
| Power Play | Penalty Kill |
|---|---|
| 4/17 power play |
8/10 penalty kill |
| PP% | PK% |
| 23.5% power play |
80.0% penalty kill |
Goals by Period
| 1 | 2 | 3 | OT |
| 3 | 6 | 5 | 0 |
Team Leaders
| Categories | Players | Statistics |
| GOALS | Jeff Deacon | 5 |
| ASSISTS | Dan Bacon , Bryce Connor | 4 |
| TOTAL POINTS | Jeff Deacon | 7 |
| SHOTS ON GOAL | Jeff Deacon | 24 |
| SHOOTING % | Mark Wilson | 0.214 |
| HAT TRICKS | Mark Wilson | 0 |
| PLAY MAKERS | Bryce Connor | 1 |
| LONGEST SCORING STREAK | Jeff Deacon | 4 |
| SHUTOUTS | Jeff Deacon | 0 |
| GOALIE WINNING PCT. | Wes Deacon G , Regis Mullen S G | 0.500 |
| GOALS AGAINST AVERAGE | Regis Mullen S G | 3.00 |
| SAVES PER GAME | Regis Mullen S G | 35.50 |
| SAVE PCT. | Regis Mullen S G | 0.922 |
Goalies need a minimum 2 games to qualify. Players need a min of 1 shot/game.
BLACK ( 0 - 1 - 0 )
Individual Team Statistics
| Players | GP | G | A | PTS | SOG | SPCT | PIM | G/G | A/G | P/G | S/G | PIM/G | HT | PM | GS | LS | |
|---|---|---|---|---|---|---|---|---|---|---|---|---|---|---|---|---|---|
|
1 .
|
Justin Ineman S | 1 | 2 | 0 | 2 | 2 | 1.000 | 0 | 2.00 | 0.00 | 2.00 | 2.00 | 0.00 | 0 | 0 | 1 | 1 |
|
2 .
|
Matt Bartley | 1 | 1 | 1 | 2 | 10 | 0.100 | 0 | 1.00 | 1.00 | 2.00 | %10.00 | 0.00 | 0 | 0 | 1 | 1 |
|
3 .
|
Jack Cross | 1 | 1 | 1 | 2 | 1 | 1.000 | 2 | 1.00 | 1.00 | 2.00 | 1.00 | 2.00 | 0 | 0 | 1 | 1 |
|
4 .
|
Kevin Kreshover | 1 | 0 | 2 | 2 | 3 | 0.000 | 0 | 0.00 | 2.00 | 2.00 | 3.00 | 0.00 | 0 | 0 | 0 | 0 |
|
5 .
|
Grant Passell G | 1 | 0 | 0 | 0 | 0 | 0.000 | 0 | 0.00 | 0.00 | 0.00 | 1.00 | 0.00 | 0 | 0 | 0 | 0 |
|
6 .
|
Josh Heyka | 1 | 0 | 0 | 0 | 0 | 0.000 | 0 | 0.00 | 0.00 | 0.00 | 1.00 | 0.00 | 0 | 0 | 0 | 0 |
|
7 .
|
Mark Knaus | 1 | 0 | 0 | 0 | 1 | 0.000 | 0 | 0.00 | 0.00 | 0.00 | 1.00 | 0.00 | 0 | 0 | 0 | 0 |
|
8 .
|
Steve Washawsky | 1 | 0 | 0 | 0 | 4 | 0.000 | 2 | 0.00 | 0.00 | 0.00 | 4.00 | 2.00 | 0 | 0 | 0 | 0 |
| TOTALS | 1 | 4 | 4 | 8 | 21 | 0.190 | 4 | 4.00 | 4.00 | 8.00 | 21.00 | 4.00 | 0 | 0 | - | - |
Individual Goalie Statistics
| Players | GP | W | L | T | GAA | PER | SV | SV% | SA | GA | SHO | SA1 | GA1 | SA2 | GA2 | SA3 | GA3 | |
|---|---|---|---|---|---|---|---|---|---|---|---|---|---|---|---|---|---|---|
|
1 .
|
Grant Passell G | 1 | 0 | 1 | 0 | 6.00 | 3 | 59 | 0.908 | 65 | 6 | 0 | 27 | 2 | 15 | 3 | 23 | 1 |
| TOTALS | 1 | 0 | 0 | 0 | 6.00 | 0 | 59 | 0.908 | 65 | 6 | 0 | 27 | 2 | 15 | 3 | 23 | 1 |
Team Record: 0 - 1 - 0 (0.000 )
Game 1
2/18
4- 7
WHITE
AWAY
2/18
4- 7
WHITE
AWAY
Goals Scored
Goals Allowed
4.00
goals/game
goals/game
7.00
goals/game
goals/game
Differential
-3.00
goals/game
goals/game
| Power Play | Penalty Kill |
|---|---|
| 0/ 0 power play |
1/ 1 penalty kill |
| PP% | PK% |
| 0.0% power play |
100.0% penalty kill |
Goals by Period
| 1 | 2 | 3 | OT |
| 0 | 4 | 0 | 0 |
Team Leaders
| Categories | Players | Statistics |
| GOALS | Justin Ineman S | 2 |
| ASSISTS | Kevin Kreshover | 2 |
| TOTAL POINTS | 4 players are tied with | 2 |
| SHOTS ON GOAL | Matt Bartley | 10 |
| SHOOTING % | Jack Cross , Justin Ineman S | 1.000 |
| HAT TRICKS | Jack Cross | 0 |
| PLAY MAKERS | Jack Cross | 0 |
| LONGEST SCORING STREAK | Matt Bartley , Jack Cross , Justin Ineman S | 1 |
| SHUTOUTS | Matt Bartley | 0 |
| GOALIE WINNING PCT. | Matt Bartley | ***** |
| GOALS AGAINST AVERAGE | Grant Passell G | 6.00 |
| SAVES PER GAME | Grant Passell G | 59.00 |
| SAVE PCT. | Grant Passell G | 0.908 |
Goalies need a minimum 0 games to qualify. Players need a min of 1 shot/game.
GREEN ( 1 - 1 - 0 )
Individual Team Statistics
| Players | GP | G | A | PTS | SOG | SPCT | PIM | G/G | A/G | P/G | S/G | PIM/G | HT | PM | GS | LS | |
|---|---|---|---|---|---|---|---|---|---|---|---|---|---|---|---|---|---|
|
1 .
|
Brian Stovsky | 3 | 5 | 5 | 10 | 16 | 0.313 | 0 | 1.67 | 1.67 | 3.33 | 5.33 | 0.00 | 1 | 1 | 3 | 3 |
|
2 .
|
Branden Henning | 1 | 2 | 2 | 4 | 6 | 0.333 | 0 | 2.00 | 2.00 | 4.00 | 6.00 | 0.00 | 0 | 0 | 1 | 1 |
|
3 .
|
Wiley Miller | 3 | 1 | 3 | 4 | 8 | 0.125 | 0 | 0.33 | 1.00 | 1.33 | 2.67 | 0.00 | 0 | 1 | 0 | 1 |
|
4 .
|
Brian O'Neill | 3 | 2 | 2 | 4 | 10 | 0.200 | 0 | 0.67 | 0.67 | 1.33 | 3.33 | 0.00 | 0 | 0 | 2 | 2 |
|
5 .
|
Adam Reisig | 3 | 1 | 3 | 4 | 7 | 0.143 | 0 | 0.33 | 1.00 | 1.33 | 2.33 | 0.00 | 0 | 0 | 0 | 1 |
|
6 .
|
Tom Burtnett | 3 | 3 | 0 | 3 | 11 | 0.273 | 0 | 1.00 | 0.00 | 1.00 | 3.67 | 0.00 | 0 | 0 | 3 | 3 |
|
7 .
|
Steve London | 1 | 0 | 2 | 2 | 2 | 0.000 | 0 | 0.00 | 2.00 | 2.00 | 2.00 | 0.00 | 0 | 0 | 0 | 0 |
|
8 .
|
Mike Fellenbaum | 2 | 0 | 2 | 2 | 4 | 0.000 | 4 | 0.00 | 1.00 | 1.00 | 2.00 | 2.00 | 0 | 0 | 0 | 0 |
|
9 .
|
John Sullivan | 3 | 1 | 0 | 1 | 3 | 0.333 | 0 | 0.33 | 0.00 | 0.33 | 1.00 | 0.00 | 0 | 0 | 0 | 1 |
|
10 .
|
Nate Bonacuse | 1 | 0 | 1 | 1 | 2 | 0.000 | 0 | 0.00 | 1.00 | 1.00 | 2.00 | 0.00 | 0 | 0 | 0 | 0 |
|
11 .
|
Paul Oppedal | 3 | 0 | 1 | 1 | 6 | 0.000 | 2 | 0.00 | 0.33 | 0.33 | 2.00 | 0.67 | 0 | 0 | 0 | 0 |
|
12 .
|
Mark Henning | 3 | 0 | 1 | 1 | 5 | 0.000 | 0 | 0.00 | 0.33 | 0.33 | 1.67 | 0.00 | 0 | 0 | 0 | 0 |
|
13 .
|
Cooper Mears S G | 2 | 0 | 0 | 0 | 0 | 0.000 | 0 | 0.00 | 0.00 | 0.00 | 0.50 | 0.00 | 0 | 0 | 0 | 0 |
|
14 .
|
Regis Mullen S G | 1 | 0 | 0 | 0 | 0 | 0.000 | 0 | 0.00 | 0.00 | 0.00 | 1.00 | 0.00 | 0 | 0 | 0 | 0 |
|
15 .
|
Tim Gascoigne | 2 | 0 | 0 | 0 | 4 | 0.000 | 0 | 0.00 | 0.00 | 0.00 | 2.00 | 0.00 | 0 | 0 | 0 | 0 |
| TOTALS | 2 | 15 | 22 | 37 | 84 | 0.179 | 6 | 7.50 | 11.00 | 18.50 | 42.00 | 3.00 | 1 | 2 | - | - |
Individual Goalie Statistics
| Players | GP | W | L | T | GAA | PER | SV | SV% | SA | GA | SHO | SA1 | GA1 | SA2 | GA2 | SA3 | GA3 | |
|---|---|---|---|---|---|---|---|---|---|---|---|---|---|---|---|---|---|---|
|
1 .
|
Regis Mullen S G | 1 | 1 | 0 | 0 | 1.00 | 3 | 20 | 0.952 | 21 | 1 | 0 | 7 | 0 | 7 | 0 | 7 | 1 |
|
2 .
|
Cooper Mears S G | 2 | 0 | 2 | 0 | 7.00 | 6 | 46 | 0.767 | 60 | 14 | 0 | 18 | 2 | 20 | 6 | 22 | 6 |
| TOTALS | 2 | 0 | 0 | 0 | 7.50 | 0 | 66 | 0.815 | 81 | 15 | 0 | 25 | 2 | 27 | 6 | 29 | 7 |
Team Record: 1 - 1 - 0 (0.500 )
Game 1
2/15
9- 1
RED
HOME
2/15
9- 1
RED
HOME
Game 2
2/22
3- 7
YELLOW
AWAY
2/22
3- 7
YELLOW
AWAY
Goals Scored
Goals Allowed
6.00
goals/game
goals/game
4.00
goals/game
goals/game
Differential
+2.00
goals/game
goals/game
| Power Play | Penalty Kill |
|---|---|
| 0/ 3 power play |
3/ 3 penalty kill |
| PP% | PK% |
| 0.0% power play |
100.0% penalty kill |
Goals by Period
| 1 | 2 | 3 | OT |
| 8 | 0 | 4 | 0 |
Team Leaders
| Categories | Players | Statistics |
| GOALS | Brian Stovsky | 5 |
| ASSISTS | Brian Stovsky | 5 |
| TOTAL POINTS | Brian Stovsky | 10 |
| SHOTS ON GOAL | Brian Stovsky | 16 |
| SHOOTING % | Branden Henning , John Sullivan | 0.333 |
| HAT TRICKS | Brian Stovsky | 1 |
| PLAY MAKERS | Wiley Miller , Brian Stovsky | 1 |
| LONGEST SCORING STREAK | Tom Burtnett , Brian Stovsky | 3 |
| SHUTOUTS | Tom Burtnett | 0 |
| GOALIE WINNING PCT. | Regis Mullen S G | 1.000 |
| GOALS AGAINST AVERAGE | Regis Mullen S G | 1.00 |
| SAVES PER GAME | Cooper Mears S G | 23.00 |
| SAVE PCT. | Regis Mullen S G | 0.952 |
Goalies need a minimum 1 games to qualify. Players need a min of 1 shot/game.
WHITE ( 1 - 1 - 0 )
Individual Team Statistics
| Players | GP | G | A | PTS | SOG | SPCT | PIM | G/G | A/G | P/G | S/G | PIM/G | HT | PM | GS | LS | |
|---|---|---|---|---|---|---|---|---|---|---|---|---|---|---|---|---|---|
|
1 .
|
Joel Chetner | 2 | 1 | 4 | 5 | 14 | 0.071 | 2 | 0.50 | 2.00 | 2.50 | 7.00 | 1.00 | 0 | 1 | 0 | 1 |
|
2 .
|
Nate Hochstadler | 2 | 3 | 2 | 5 | 13 | 0.231 | 2 | 1.50 | 1.00 | 2.50 | 6.50 | 1.00 | 1 | 0 | 0 | 1 |
|
3 .
|
Kyle Kreiner | 1 | 2 | 0 | 2 | 8 | 0.250 | 0 | 2.00 | 0.00 | 2.00 | 8.00 | 0.00 | 0 | 0 | 1 | 1 |
|
4 .
|
Dave Lurie | 2 | 0 | 2 | 2 | 4 | 0.000 | 0 | 0.00 | 1.00 | 1.00 | 2.00 | 0.00 | 0 | 0 | 0 | 0 |
|
5 .
|
Evan Nolan | 1 | 0 | 1 | 1 | 1 | 0.000 | 2 | 0.00 | 1.00 | 1.00 | 1.00 | 2.00 | 0 | 0 | 0 | 0 |
|
6 .
|
Brad Wheeler | 2 | 0 | 1 | 1 | 3 | 0.000 | 4 | 0.00 | 0.50 | 0.50 | 1.50 | 2.00 | 0 | 0 | 0 | 0 |
|
7 .
|
Jeff Kapp | 2 | 0 | 1 | 1 | 4 | 0.000 | 2 | 0.00 | 0.50 | 0.50 | 2.00 | 1.00 | 0 | 0 | 0 | 0 |
|
8 .
|
Anthony Bokar | 2 | 0 | 1 | 1 | 10 | 0.000 | 0 | 0.00 | 0.50 | 0.50 | 5.00 | 0.00 | 0 | 0 | 0 | 0 |
|
9 .
|
Mike Lukegord | 1 | 1 | 0 | 1 | 4 | 0.250 | 0 | 1.00 | 0.00 | 1.00 | 4.00 | 0.00 | 0 | 0 | 1 | 1 |
|
10 .
|
Brian Bradley | 2 | 1 | 0 | 1 | 6 | 0.167 | 2 | 0.50 | 0.00 | 0.50 | 3.00 | 1.00 | 0 | 0 | 1 | 1 |
|
11 .
|
Ryan Mayhugh | 2 | 1 | 0 | 1 | 5 | 0.200 | 0 | 0.50 | 0.00 | 0.50 | 2.50 | 0.00 | 0 | 0 | 0 | 1 |
|
12 .
|
Glenn Shtarkman | 2 | 0 | 0 | 0 | 3 | 0.000 | 0 | 0.00 | 0.00 | 0.00 | 1.50 | 0.00 | 0 | 0 | 0 | 0 |
|
13 .
|
Justin Wolf | 2 | 0 | 0 | 0 | 8 | 0.000 | 0 | 0.00 | 0.00 | 0.00 | 4.00 | 0.00 | 0 | 0 | 0 | 0 |
|
14 .
|
Frank Theiss G | 2 | 0 | 0 | 0 | 0 | 0.000 | 0 | 0.00 | 0.00 | 0.00 | 0.50 | 0.00 | 0 | 0 | 0 | 0 |
|
15 .
|
Noah Leavitt | 2 | 0 | 0 | 0 | 4 | 0.000 | 0 | 0.00 | 0.00 | 0.00 | 2.00 | 0.00 | 0 | 0 | 0 | 0 |
|
16 .
|
John Koppitch | 2 | 0 | 0 | 0 | 2 | 0.000 | 0 | 0.00 | 0.00 | 0.00 | 1.00 | 0.00 | 0 | 0 | 0 | 0 |
| TOTALS | 2 | 9 | 12 | 21 | 89 | 0.101 | 14 | 4.50 | 6.00 | 10.50 | 44.50 | 7.00 | 1 | 1 | - | - |
Individual Goalie Statistics
| Players | GP | W | L | T | GAA | PER | SV | SV% | SA | GA | SHO | SA1 | GA1 | SA2 | GA2 | SA3 | GA3 | |
|---|---|---|---|---|---|---|---|---|---|---|---|---|---|---|---|---|---|---|
|
1 .
|
Frank Theiss G | 2 | 1 | 1 | 0 | 5.00 | 6 | 40 | 0.800 | 50 | 10 | 0 | 18 | 3 | 19 | 5 | 13 | 2 |
| TOTALS | 2 | 0 | 0 | 0 | 5.00 | 0 | 40 | 0.800 | 50 | 10 | 0 | 18 | 3 | 19 | 5 | 13 | 2 |
Team Record: 1 - 1 - 0 (0.500 )
Game 1
2/18
7- 4
BLACK
HOME
2/18
7- 4
BLACK
HOME
Game 2
2/20
2- 6
BLUE
AWAY
2/20
2- 6
BLUE
AWAY
Goals Scored
Goals Allowed
4.50
goals/game
goals/game
5.00
goals/game
goals/game
Differential
-0.50
goals/game
goals/game
| Power Play | Penalty Kill |
|---|---|
| 0/ 1 power play |
4/ 6 penalty kill |
| PP% | PK% |
| 0.0% power play |
66.7% penalty kill |
Goals by Period
| 1 | 2 | 3 | OT |
| 2 | 4 | 3 | 0 |
Team Leaders
| Categories | Players | Statistics |
| GOALS | Nate Hochstadler | 3 |
| ASSISTS | Joel Chetner | 4 |
| TOTAL POINTS | Joel Chetner , Nate Hochstadler | 5 |
| SHOTS ON GOAL | Joel Chetner | 14 |
| SHOOTING % | Kyle Kreiner , Mike Lukegord | 0.250 |
| HAT TRICKS | Nate Hochstadler | 1 |
| PLAY MAKERS | Joel Chetner | 1 |
| LONGEST SCORING STREAK | 6 players are tied with | 1 |
| SHUTOUTS | Brian Bradley | 0 |
| GOALIE WINNING PCT. | Frank Theiss G | 0.500 |
| GOALS AGAINST AVERAGE | Frank Theiss G | 5.00 |
| SAVES PER GAME | Frank Theiss G | 20.00 |
| SAVE PCT. | Frank Theiss G | 0.800 |
Goalies need a minimum 1 games to qualify. Players need a min of 1 shot/game.
YELLOW ( 3 - 1 - 0 )
Individual Team Statistics
| Players | GP | G | A | PTS | SOG | SPCT | PIM | G/G | A/G | P/G | S/G | PIM/G | HT | PM | GS | LS | |
|---|---|---|---|---|---|---|---|---|---|---|---|---|---|---|---|---|---|
|
1 .
|
Sean Collins | 5 | 5 | 6 | 11 | 22 | 0.227 | 0 | 1.00 | 1.20 | 2.20 | 4.40 | 0.00 | 0 | 0 | 5 | 5 |
|
2 .
|
Andrew Haffner | 5 | 4 | 6 | 10 | 26 | 0.154 | 2 | 0.80 | 1.20 | 2.00 | 5.20 | 0.40 | 0 | 0 | 0 | 2 |
|
3 .
|
Brad Forward | 5 | 6 | 3 | 9 | 25 | 0.240 | 2 | 1.20 | 0.60 | 1.80 | 5.00 | 0.40 | 0 | 0 | 1 | 3 |
|
4 .
|
Jon Rice | 5 | 1 | 5 | 6 | 14 | 0.071 | 4 | 0.20 | 1.00 | 1.20 | 2.80 | 0.80 | 0 | 0 | 0 | 1 |
|
5 .
|
Jeff Hammel | 5 | 4 | 0 | 4 | 13 | 0.308 | 4 | 0.80 | 0.00 | 0.80 | 2.60 | 0.80 | 0 | 0 | 0 | 3 |
|
6 .
|
John Rutter | 3 | 0 | 3 | 3 | 9 | 0.000 | 4 | 0.00 | 1.00 | 1.00 | 3.00 | 1.33 | 0 | 0 | 0 | 0 |
|
7 .
|
Brandon Detzel | 5 | 1 | 2 | 3 | 10 | 0.100 | 2 | 0.20 | 0.40 | 0.60 | 2.00 | 0.40 | 0 | 0 | 1 | 1 |
|
8 .
|
Dan Brown | 5 | 2 | 1 | 3 | 12 | 0.167 | 2 | 0.40 | 0.20 | 0.60 | 2.40 | 0.40 | 0 | 0 | 1 | 1 |
|
9 .
|
BJ Solaru | 5 | 2 | 0 | 2 | 8 | 0.250 | 4 | 0.40 | 0.00 | 0.40 | 1.60 | 0.80 | 0 | 0 | 0 | 2 |
|
10 .
|
Pat Miller | 5 | 1 | 1 | 2 | 9 | 0.111 | 4 | 0.20 | 0.20 | 0.40 | 1.80 | 0.80 | 0 | 0 | 1 | 1 |
|
11 .
|
Lilly Hammel | 5 | 0 | 1 | 1 | 9 | 0.000 | 0 | 0.00 | 0.20 | 0.20 | 1.80 | 0.00 | 0 | 0 | 0 | 0 |
|
12 .
|
Bill Scanlon | 5 | 0 | 0 | 0 | 4 | 0.000 | 0 | 0.00 | 0.00 | 0.00 | 0.80 | 0.00 | 0 | 0 | 0 | 0 |
|
13 .
|
Yi Yang G | 5 | 0 | 0 | 0 | 0 | 0.000 | 0 | 0.00 | 0.00 | 0.00 | 0.20 | 0.00 | 0 | 0 | 0 | 0 |
|
14 .
|
Sam Lauritzen | 2 | 0 | 0 | 0 | 4 | 0.000 | 4 | 0.00 | 0.00 | 0.00 | 2.00 | 2.00 | 0 | 0 | 0 | 0 |
|
15 .
|
Mike Borden | 3 | 0 | 0 | 0 | 2 | 0.000 | 0 | 0.00 | 0.00 | 0.00 | 0.67 | 0.00 | 0 | 0 | 0 | 0 |
| TOTALS | 4 | 26 | 28 | 54 | 167 | 0.156 | 32 | 6.50 | 7.00 | 13.50 | 41.75 | 8.00 | 0 | 0 | - | - |
Individual Goalie Statistics
| Players | GP | W | L | T | GAA | PER | SV | SV% | SA | GA | SHO | SA1 | GA1 | SA2 | GA2 | SA3 | GA3 | |
|---|---|---|---|---|---|---|---|---|---|---|---|---|---|---|---|---|---|---|
|
1 .
|
Yi Yang G | 5 | 4 | 1 | 0 | 2.80 | 15 | 146 | 0.913 | 160 | 14 | 0 | 56 | 6 | 50 | 5 | 54 | 3 |
| TOTALS | 4 | 0 | 0 | 0 | 3.50 | 0 | 146 | 0.913 | 160 | 14 | 0 | 56 | 6 | 50 | 5 | 54 | 3 |
Team Record: 3 - 1 - 0 (0.750 )
| Game 1 2/22 7- 3 GREEN AWAY |
Game 2 2/25 6- 2 BLUE AWAY |
Game 3 2/27 1- 2 BLUE HOME |
Game 4 2/29 5- 4 BLUE AWAY |
Goals Scored
Goals Allowed
4.75
goals/game
goals/game
2.75
goals/game
goals/game
Differential
+2.00
goals/game
goals/game
| Power Play | Penalty Kill |
|---|---|
| 2/11 power play |
10/12 penalty kill |
| PP% | PK% |
| 18.2% power play |
83.3% penalty kill |
Goals by Period
| 1 | 2 | 3 | OT |
| 5 | 6 | 7 | 1 |
Team Leaders
| Categories | Players | Statistics |
| GOALS | Brad Forward | 6 |
| ASSISTS | Sean Collins , Andrew Haffner | 6 |
| TOTAL POINTS | Sean Collins | 11 |
| SHOTS ON GOAL | Andrew Haffner | 26 |
| SHOOTING % | Jeff Hammel | 0.308 |
| HAT TRICKS | Jeff Hammel | 0 |
| PLAY MAKERS | Jeff Hammel | 0 |
| LONGEST SCORING STREAK | Sean Collins | 5 |
| SHUTOUTS | Sean Collins | 0 |
| GOALIE WINNING PCT. | Yi Yang G | 0.800 |
| GOALS AGAINST AVERAGE | Yi Yang G | 2.80 |
| SAVES PER GAME | Yi Yang G | 29.20 |
| SAVE PCT. | Yi Yang G | 0.913 |
Goalies need a minimum 2 games to qualify. Players need a min of 1 shot/game.
RED ( 0 - 1 - 0 )
Individual Team Statistics
| Players | GP | G | A | PTS | SOG | SPCT | PIM | G/G | A/G | P/G | S/G | PIM/G | HT | PM | GS | LS | |
|---|---|---|---|---|---|---|---|---|---|---|---|---|---|---|---|---|---|
|
1 .
|
Jacob Coffey | 1 | 1 | 0 | 1 | 5 | 0.200 | 0 | 1.00 | 0.00 | 1.00 | 5.00 | 0.00 | 0 | 0 | 1 | 1 |
|
2 .
|
Charles Huse | 1 | 0 | 1 | 1 | 2 | 0.000 | 0 | 0.00 | 1.00 | 1.00 | 2.00 | 0.00 | 0 | 0 | 0 | 0 |
|
3 .
|
Greg Kirchenbaum | 1 | 0 | 1 | 1 | 2 | 0.000 | 2 | 0.00 | 1.00 | 1.00 | 2.00 | 2.00 | 0 | 0 | 0 | 0 |
|
4 .
|
John Pustai | 1 | 0 | 0 | 0 | 3 | 0.000 | 0 | 0.00 | 0.00 | 0.00 | 3.00 | 0.00 | 0 | 0 | 0 | 0 |
|
5 .
|
Dave Kresnye G | 1 | 0 | 0 | 0 | 0 | 0.000 | 0 | 0.00 | 0.00 | 0.00 | 1.00 | 0.00 | 0 | 0 | 0 | 0 |
|
6 .
|
Connor Fix Red Tm | 1 | 0 | 0 | 0 | 2 | 0.000 | 0 | 0.00 | 0.00 | 0.00 | 2.00 | 0.00 | 0 | 0 | 0 | 0 |
|
7 .
|
Matt Bachovchin | 1 | 0 | 0 | 0 | 3 | 0.000 | 0 | 0.00 | 0.00 | 0.00 | 3.00 | 0.00 | 0 | 0 | 0 | 0 |
|
8 .
|
Kevin Ignasiak | 1 | 0 | 0 | 0 | 3 | 0.000 | 0 | 0.00 | 0.00 | 0.00 | 3.00 | 0.00 | 0 | 0 | 0 | 0 |
| TOTALS | 1 | 1 | 2 | 3 | 20 | 0.050 | 2 | 1.00 | 2.00 | 3.00 | 20.00 | 2.00 | 0 | 0 | - | - |
Individual Goalie Statistics
| Players | GP | W | L | T | GAA | PER | SV | SV% | SA | GA | SHO | SA1 | GA1 | SA2 | GA2 | SA3 | GA3 | |
|---|---|---|---|---|---|---|---|---|---|---|---|---|---|---|---|---|---|---|
|
1 .
|
Dave Kresnye G | 1 | 0 | 1 | 0 | 9.00 | 3 | 23 | 0.719 | 32 | 9 | 0 | 12 | 5 | 9 | 0 | 11 | 4 |
| TOTALS | 1 | 0 | 0 | 0 | 9.00 | 0 | 23 | 0.719 | 32 | 9 | 0 | 12 | 5 | 9 | 0 | 11 | 4 |
Team Record: 0 - 1 - 0 (0.000 )
Game 1
2/15
1- 9
GREEN
AWAY
2/15
1- 9
GREEN
AWAY
Goals Scored
Goals Allowed
1.00
goals/game
goals/game
9.00
goals/game
goals/game
Differential
-8.00
goals/game
goals/game
| Power Play | Penalty Kill |
|---|---|
| 0/ 1 power play |
1/ 1 penalty kill |
| PP% | PK% |
| 0.0% power play |
100.0% penalty kill |
Goals by Period
| 1 | 2 | 3 | OT |
| 0 | 0 | 1 | 0 |
Team Leaders
| Categories | Players | Statistics |
| GOALS | Jacob Coffey | 1 |
| ASSISTS | Charles Huse , Greg Kirchenbaum | 1 |
| TOTAL POINTS | Jacob Coffey , Charles Huse , Greg Kirchenbaum | 1 |
| SHOTS ON GOAL | Jacob Coffey | 5 |
| SHOOTING % | Jacob Coffey | 0.200 |
| HAT TRICKS | Jacob Coffey | 0 |
| PLAY MAKERS | Jacob Coffey | 0 |
| LONGEST SCORING STREAK | Jacob Coffey | 1 |
| SHUTOUTS | Jacob Coffey | 0 |
| GOALIE WINNING PCT. | Jacob Coffey | ***** |
| GOALS AGAINST AVERAGE | Dave Kresnye G | 9.00 |
| SAVES PER GAME | Dave Kresnye G | 23.00 |
| SAVE PCT. | Dave Kresnye G | 0.719 |
Goalies need a minimum 0 games to qualify. Players need a min of 1 shot/game.
Team Standings
2/29/24 | PRINTOUT #: 2
| Teams | GP | W | L | T | GS/G | GA/G | GD/G | PCT | LWS | PS | PTS |
| 1. YELLOW | 4 | 3 | 1 | 0 | 4.8 | 2.8 | +2.0 | 0.750 | 2 | 1W | 6 |
| 2. BLUE | 4 | 2 | 2 | 0 | 3.5 | 3.5 | +0.0 | 0.500 | 1 | 1L | 4 |
| 3. WHITE | 2 | 1 | 1 | 0 | 4.5 | 5.0 | -0.5 | 0.500 | 1 | 1L | 2 |
| 4. GREEN | 2 | 1 | 1 | 0 | 6.0 | 4.0 | +2.0 | 0.500 | 1 | 1L | 2 |
| 5. BLACK | 1 | 0 | 1 | 0 | 4.0 | 7.0 | -3.0 | 0.000 | 0 | 1L | 0 |
| 6. RED | 1 | 0 | 1 | 0 | 1.0 | 9.0 | -8.0 | 0.000 | 0 | 1L | 0 |
Team Statistics
| TEAMS | GP | GS | GA | A | PTS | HT | PM | PIM | PIM/G | PP | PP% | PK | PK% | SHG | SV | SA | SV% |
|---|---|---|---|---|---|---|---|---|---|---|---|---|---|---|---|---|---|
|
1. YELLOW
|
4 | 26 | 14 | 28 | 54 | 0 | 0 | 32 | 8.0 | 2 / 11 | 18.2% | 10 / 12 | 83.3% | 0 | 146 | 160 | 0.913 |
|
2. GREEN
|
2 | 15 | 15 | 22 | 37 | 1 | 2 | 6 | 3.0 | 0 / 3 | 0.0% | 3 / 3 | 100.0% | 0 | 66 | 81 | 0.815 |
|
3. BLUE
|
4 | 14 | 14 | 19 | 33 | 0 | 1 | 24 | 6.0 | 4 / 17 | 23.5% | 8 / 10 | 80.0% | 0 | 116 | 130 | 0.892 |
|
4. WHITE
|
2 | 9 | 10 | 12 | 21 | 1 | 1 | 14 | 7.0 | 0 / 1 | 0.0% | 4 / 6 | 66.7% | 1 | 40 | 50 | 0.800 |
|
5. BLACK
|
1 | 4 | 6 | 4 | 8 | 0 | 0 | 4 | 4.0 | 0 / 0 | 0.0% | 1 / 1 | 100.0% | 1 | 59 | 65 | 0.908 |
|
6. RED
|
1 | 1 | 9 | 2 | 3 | 0 | 0 | 2 | 2.0 | 0 / 1 | 0.0% | 1 / 1 | 100.0% | 0 | 23 | 32 | 0.719 |
Individual League Leaders
Goals
| Players | Team | GP | G | G/GP | |
|---|---|---|---|---|---|
|
1.
|
Brad Forward | YELLOW | 5 | 6 | 1.20 |
|
2.
|
Brian Stovsky | GREEN | 3 | 5 | 1.67 |
|
3.
|
Jeff Deacon | BLUE | 4 | 5 | 1.25 |
|
4.
|
Sean Collins | YELLOW | 5 | 5 | 1.00 |
|
5.
|
Andrew Haffner | YELLOW | 5 | 4 | 0.80 |
|
6.
|
Jeff Hammel | YELLOW | 5 | 4 | 0.80 |
|
7.
|
Tom Burtnett | GREEN | 3 | 3 | 1.00 |
|
8.
|
Nate Hochstadler | WHITE | 2 | 3 | 1.50 |
|
9.
|
Mark Wilson | BLUE | 3 | 3 | 1.00 |
|
10.
|
Brian O'Neill | GREEN | 3 | 2 | 0.67 |
|
11.
|
BJ Solaru | YELLOW | 5 | 2 | 0.40 |
|
12.
|
Branden Henning | GREEN | 1 | 2 | 2.00 |
|
13.
|
Kyle Kreiner | WHITE | 1 | 2 | 2.00 |
|
14.
|
Dan Brown | YELLOW | 5 | 2 | 0.40 |
|
15.
|
Rich Garcia | BLUE | 4 | 2 | 0.50 |
|
16.
|
Justin Ineman S | BLACK | 1 | 2 | 2.00 |
|
17.
|
Brian Bradley | WHITE | 2 | 1 | 0.50 |
|
18.
|
Joel Chetner | WHITE | 2 | 1 | 0.50 |
|
19.
|
John Sullivan | GREEN | 3 | 1 | 0.33 |
|
20.
|
Adam Reisig | GREEN | 3 | 1 | 0.33 |
Assists
| Players | Team | GP | A | A/GP | |
|---|---|---|---|---|---|
|
1.
|
Sean Collins | YELLOW | 5 | 6 | 1.20 |
|
2.
|
Andrew Haffner | YELLOW | 5 | 6 | 1.20 |
|
3.
|
Brian Stovsky | GREEN | 3 | 5 | 1.67 |
|
4.
|
Jon Rice | YELLOW | 5 | 5 | 1.00 |
|
5.
|
Bryce Connor | BLUE | 2 | 4 | 2.00 |
|
6.
|
Dan Bacon | BLUE | 4 | 4 | 1.00 |
|
7.
|
Joel Chetner | WHITE | 2 | 4 | 2.00 |
|
8.
|
John Rutter | YELLOW | 3 | 3 | 1.00 |
|
9.
|
Wiley Miller | GREEN | 3 | 3 | 1.00 |
|
10.
|
Adam Reisig | GREEN | 3 | 3 | 1.00 |
|
11.
|
Brad Forward | YELLOW | 5 | 3 | 0.60 |
|
12.
|
Dave Lurie | WHITE | 2 | 2 | 1.00 |
|
13.
|
Mike Fellenbaum | GREEN | 2 | 2 | 1.00 |
|
14.
|
Branden Henning | GREEN | 1 | 2 | 2.00 |
|
15.
|
Brian Callow | BLUE | 2 | 2 | 1.00 |
|
16.
|
Steve London | GREEN | 1 | 2 | 2.00 |
|
17.
|
Kevin Kreshover | BLACK | 1 | 2 | 2.00 |
|
18.
|
Brian O'Neill | GREEN | 3 | 2 | 0.67 |
|
19.
|
Brandon Detzel | YELLOW | 5 | 2 | 0.40 |
|
20.
|
Nate Hochstadler | WHITE | 2 | 2 | 1.00 |
Points
| Players | Team | GP | G | A | P | P/GP | |
|---|---|---|---|---|---|---|---|
|
1.
|
Sean Collins | YELLOW | 5 | 5 | 6 | 11 | 2.20 |
|
2.
|
Brian Stovsky | GREEN | 3 | 5 | 5 | 10 | 3.33 |
|
3.
|
Andrew Haffner | YELLOW | 5 | 4 | 6 | 10 | 2.00 |
|
4.
|
Brad Forward | YELLOW | 5 | 6 | 3 | 9 | 1.80 |
|
5.
|
Jeff Deacon | BLUE | 4 | 5 | 2 | 7 | 1.75 |
|
6.
|
Jon Rice | YELLOW | 5 | 1 | 5 | 6 | 1.20 |
|
7.
|
Joel Chetner | WHITE | 2 | 1 | 4 | 5 | 2.50 |
|
8.
|
Nate Hochstadler | WHITE | 2 | 3 | 2 | 5 | 2.50 |
|
9.
|
Wiley Miller | GREEN | 3 | 1 | 3 | 4 | 1.33 |
|
10.
|
Brian O'Neill | GREEN | 3 | 2 | 2 | 4 | 1.33 |
|
11.
|
Adam Reisig | GREEN | 3 | 1 | 3 | 4 | 1.33 |
|
12.
|
Branden Henning | GREEN | 1 | 2 | 2 | 4 | 4.00 |
|
13.
|
Bryce Connor | BLUE | 2 | 0 | 4 | 4 | 2.00 |
|
14.
|
Dan Bacon | BLUE | 4 | 0 | 4 | 4 | 1.00 |
|
15.
|
Jeff Hammel | YELLOW | 5 | 4 | 0 | 4 | 0.80 |
|
16.
|
Mark Wilson | BLUE | 3 | 3 | 1 | 4 | 1.33 |
|
17.
|
Rich Garcia | BLUE | 4 | 2 | 2 | 4 | 1.00 |
|
18.
|
Tom Burtnett | GREEN | 3 | 3 | 0 | 3 | 1.00 |
|
19.
|
Dan Brown | YELLOW | 5 | 2 | 1 | 3 | 0.60 |
|
20.
|
John Rutter | YELLOW | 3 | 0 | 3 | 3 | 1.00 |
|
21.
|
Alex Frazier | BLUE | 2 | 1 | 2 | 3 | 1.50 |
|
22.
|
Brandon Detzel | YELLOW | 5 | 1 | 2 | 3 | 0.60 |
|
23.
|
Kyle Kreiner | WHITE | 1 | 2 | 0 | 2 | 2.00 |
|
24.
|
Dave Lurie | WHITE | 2 | 0 | 2 | 2 | 1.00 |
|
25.
|
Steve London | GREEN | 1 | 0 | 2 | 2 | 2.00 |
|
26.
|
Mike Fellenbaum | GREEN | 2 | 0 | 2 | 2 | 1.00 |
|
27.
|
Matt Bartley | BLACK | 1 | 1 | 1 | 2 | 2.00 |
|
28.
|
Jack Cross | BLACK | 1 | 1 | 1 | 2 | 2.00 |
|
29.
|
Kevin Kreshover | BLACK | 1 | 0 | 2 | 2 | 2.00 |
|
30.
|
Brian Callow | BLUE | 2 | 0 | 2 | 2 | 1.00 |
Shots On Goal
| Players | Team | GP | S | S% | S/GP | |
|---|---|---|---|---|---|---|
|
1.
|
Andrew Haffner | YELLOW | 5 | 26 | 0.154 | 5.20 |
|
2.
|
Brad Forward | YELLOW | 5 | 25 | 0.240 | 5.00 |
|
3.
|
Jeff Deacon | BLUE | 4 | 24 | 0.208 | 6.00 |
|
4.
|
Rich Garcia | BLUE | 4 | 23 | 0.087 | 5.75 |
|
5.
|
Sean Collins | YELLOW | 5 | 22 | 0.227 | 4.40 |
|
6.
|
Brian Stovsky | GREEN | 3 | 16 | 0.313 | 5.33 |
|
7.
|
Mark Wilson | BLUE | 3 | 14 | 0.214 | 4.67 |
|
8.
|
Joel Chetner | WHITE | 2 | 14 | 0.071 | 7.00 |
|
9.
|
Jon Rice | YELLOW | 5 | 14 | 0.071 | 2.80 |
|
10.
|
Nate Hochstadler | WHITE | 2 | 13 | 0.231 | 6.50 |
|
11.
|
Jeff Hammel | YELLOW | 5 | 13 | 0.308 | 2.60 |
|
12.
|
Dan Brown | YELLOW | 5 | 12 | 0.167 | 2.40 |
|
13.
|
Tom Burtnett | GREEN | 3 | 11 | 0.273 | 3.67 |
|
14.
|
Alex Frazier | BLUE | 2 | 11 | 0.091 | 5.50 |
|
15.
|
Dan Bacon | BLUE | 4 | 11 | 0.000 | 2.75 |
|
16.
|
Brandon Detzel | YELLOW | 5 | 10 | 0.100 | 2.00 |
|
17.
|
Brian O'Neill | GREEN | 3 | 10 | 0.200 | 3.33 |
|
18.
|
Matt Bartley | BLACK | 1 | 10 | 0.100 | %10.00 |
|
19.
|
Anthony Bokar | WHITE | 2 | 10 | 0.000 | 5.00 |
|
20.
|
Bryce Connor | BLUE | 2 | 10 | 0.000 | 5.00 |
Penalty Minutes
| Players | Team | GP | PIM | PIM/GP | |
|---|---|---|---|---|---|
|
1.
|
Jacob Hoberman | BLUE | 4 | 10 | 2.50 |
|
2.
|
Mike Fellenbaum | GREEN | 2 | 4 | 2.00 |
|
3.
|
Brad Wheeler | WHITE | 2 | 4 | 2.00 |
|
4.
|
Sam Lauritzen | YELLOW | 2 | 4 | 2.00 |
|
5.
|
Pat Miller | YELLOW | 5 | 4 | 0.80 |
|
6.
|
Jon Rice | YELLOW | 5 | 4 | 0.80 |
|
7.
|
John Rutter | YELLOW | 3 | 4 | 1.33 |
|
8.
|
Jeff Hammel | YELLOW | 5 | 4 | 0.80 |
|
9.
|
BJ Solaru | YELLOW | 5 | 4 | 0.80 |
|
10.
|
Brian Bradley | WHITE | 2 | 2 | 1.00 |
|
11.
|
Joel Chetner | WHITE | 2 | 2 | 1.00 |
|
12.
|
Nate Hochstadler | WHITE | 2 | 2 | 1.00 |
|
13.
|
Jeff Kapp | WHITE | 2 | 2 | 1.00 |
|
14.
|
Evan Nolan | WHITE | 1 | 2 | 2.00 |
|
15.
|
Paul Oppedal | GREEN | 3 | 2 | 0.67 |
|
16.
|
Dan Brown | YELLOW | 5 | 2 | 0.40 |
|
17.
|
Brandon Detzel | YELLOW | 5 | 2 | 0.40 |
|
18.
|
Jimmy Moore | BLUE | 4 | 2 | 0.50 |
|
19.
|
Jack Cross | BLACK | 1 | 2 | 2.00 |
|
20.
|
Steve Washawsky | BLACK | 1 | 2 | 2.00 |
Hat Tricks
| Players | Team | GP | HT | HT/GP | |
|---|---|---|---|---|---|
|
1.
|
Nate Hochstadler | WHITE | 2 | 1 | 0.50 |
|
2.
|
Brian Stovsky | GREEN | 3 | 1 | 0.33 |
Playmakers
| Players | Team | GP | PM | PM/GP | |
|---|---|---|---|---|---|
|
1.
|
Brian Stovsky | GREEN | 3 | 1 | 0.33 |
|
2.
|
Joel Chetner | WHITE | 2 | 1 | 0.50 |
|
3.
|
Bryce Connor | BLUE | 2 | 1 | 0.50 |
|
4.
|
Wiley Miller | GREEN | 3 | 1 | 0.33 |
Goals Against Average
| Players | Team | GP | GA | GAA | |
|---|---|---|---|---|---|
|
1.
|
Regis Mullen S G | GREEN | 1 | 1 | 1.00 |
|
2.
|
Yi Yang G | YELLOW | 5 | 14 | 2.80 |
|
3.
|
Regis Mullen S G | BLUE | 2 | 6 | 3.00 |
|
4.
|
Wes Deacon G | BLUE | 2 | 8 | 4.00 |
Shutouts
| Players | Team | GP | SO | SO/GP |
Goalie Winning %
| Players | Team | GP | W | L | T | PCT | |
|---|---|---|---|---|---|---|---|
|
1.
|
Regis Mullen S G | GREEN | 1 | 1 | 0 | 0 | 1.000 |
|
2.
|
Yi Yang G | YELLOW | 5 | 4 | 1 | 0 | 0.800 |
|
3.
|
Wes Deacon G | BLUE | 2 | 1 | 1 | 0 | 0.500 |
|
4.
|
Frank Theiss G | WHITE | 2 | 1 | 1 | 0 | 0.500 |
|
5.
|
Regis Mullen S G | BLUE | 2 | 1 | 1 | 0 | 0.500 |
Saves per Game
| Players | Team | GP | SV | SV/GP | |
|---|---|---|---|---|---|
|
1.
|
Grant Passell G | BLACK | 1 | 59 | 59.00 |
|
2.
|
Regis Mullen S G | BLUE | 2 | 71 | 35.50 |
|
3.
|
Yi Yang G | YELLOW | 5 | 146 | 29.20 |
|
4.
|
Cooper Mears S G | GREEN | 2 | 46 | 23.00 |
|
5.
|
Dave Kresnye G | RED | 1 | 23 | 23.00 |
|
6.
|
Wes Deacon G | BLUE | 2 | 45 | 22.50 |
|
7.
|
Regis Mullen S G | GREEN | 1 | 20 | 20.00 |
|
8.
|
Frank Theiss G | WHITE | 2 | 40 | 20.00 |
Save Percentage
| Players | Team | GP | SV | Shots | SV% | |
|---|---|---|---|---|---|---|
|
1.
|
Regis Mullen S G | GREEN | 1 | 20 | 21 | 0.952 |
|
2.
|
Regis Mullen S G | BLUE | 2 | 71 | 77 | 0.922 |
|
3.
|
Yi Yang G | YELLOW | 5 | 146 | 160 | 0.913 |
|
4.
|
Grant Passell G | BLACK | 1 | 59 | 65 | 0.908 |
|
5.
|
Wes Deacon G | BLUE | 2 | 45 | 53 | 0.849 |
|
6.
|
Frank Theiss G | WHITE | 2 | 40 | 50 | 0.800 |
|
7.
|
Cooper Mears S G | GREEN | 2 | 46 | 60 | 0.767 |
|
8.
|
Dave Kresnye G | RED | 1 | 23 | 32 | 0.719 |
League Player of the Week
Player: Jeff Deacon
Team: BLUE
| Categories | Statistics | |
|---|---|---|
|
1.
|
Games Played | 3 |
|
2.
|
Goals Scored | 4 |
|
3.
|
Assists | 1 |
|
4.
|
Penalty Minutes | 2 |
|
5.
|
Shots on Goal | 20 |
|
6.
|
Hat Tricks | 0 |
|
7.
|
Playmakers | 0 |
|
8.
|
Shutouts | 0 |
|
9.
|
Wins | 0 |
|
10.
|
Ties | 0 |
|
11.
|
Saves | 0 |
|
12.
|
Save Percentage | 0.000 |
THIS WEEK'S PLAYER OF THE WEEK NUMBER IS 27.
Game Results For The Season
BLUE
DATE
Opponent
Score
H/A
W/L
1.
2/20
WHITE
6
- 2
Home
W
2.
2/25
YELLOW
2
- 6
Home
L
3.
2/27
YELLOW
2
- 1
Away
W
4.
2/29
YELLOW
4
- 5
Home
L
BLACK
DATE
Opponent
Score
H/A
W/L
1.
2/18
WHITE
4
- 7
Away
L
GREEN
DATE
Opponent
Score
H/A
W/L
1.
2/15
RED
9
- 1
Home
W
2.
2/22
YELLOW
3
- 7
Away
L
WHITE
DATE
Opponent
Score
H/A
W/L
1.
2/18
BLACK
7
- 4
Home
W
2.
2/20
BLUE
2
- 6
Away
L
YELLOW
DATE
Opponent
Score
H/A
W/L
1.
2/22
GREEN
7
- 3
Away
W
2.
2/25
BLUE
6
- 2
Away
W
3.
2/27
BLUE
1
- 2
Home
L
4.
2/29
BLUE
5
- 4
Away
W
RED
DATE
Opponent
Score
H/A
W/L
1.
2/15
GREEN
1
- 9
Away
L